The Frick Environmental Center
CASE STUDY: Frick Center Monitoring and Analytics
The Frick Environmental Center, through a partnership with WES.net, Comcast, and Machine Q, announced that its website will be providing a real-time view of its integrated energy and sustainability monitoring systems. Considered by many to be one of the top 10 sustainability projects in the US, the Center hopes to foster further understanding of the value of in-depth monitoring of power systems in achieving sustainability, efficiency, and resiliency goals.
The Frick Environmental Center is a joint venture between the city of Pittsburgh and the Pittsburgh Parks Conservancy and is a COTE® Top Ten Award winner.
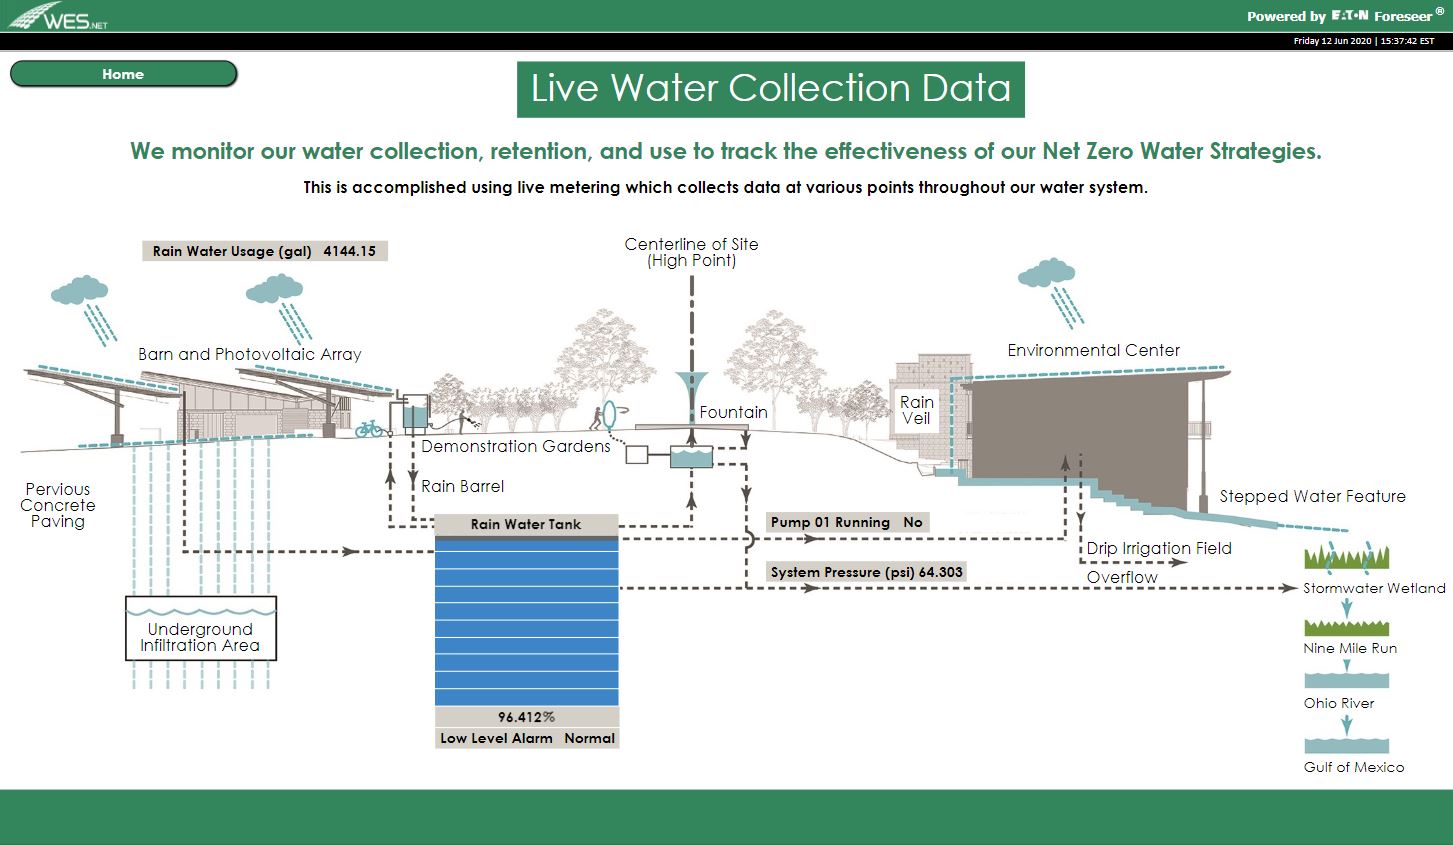
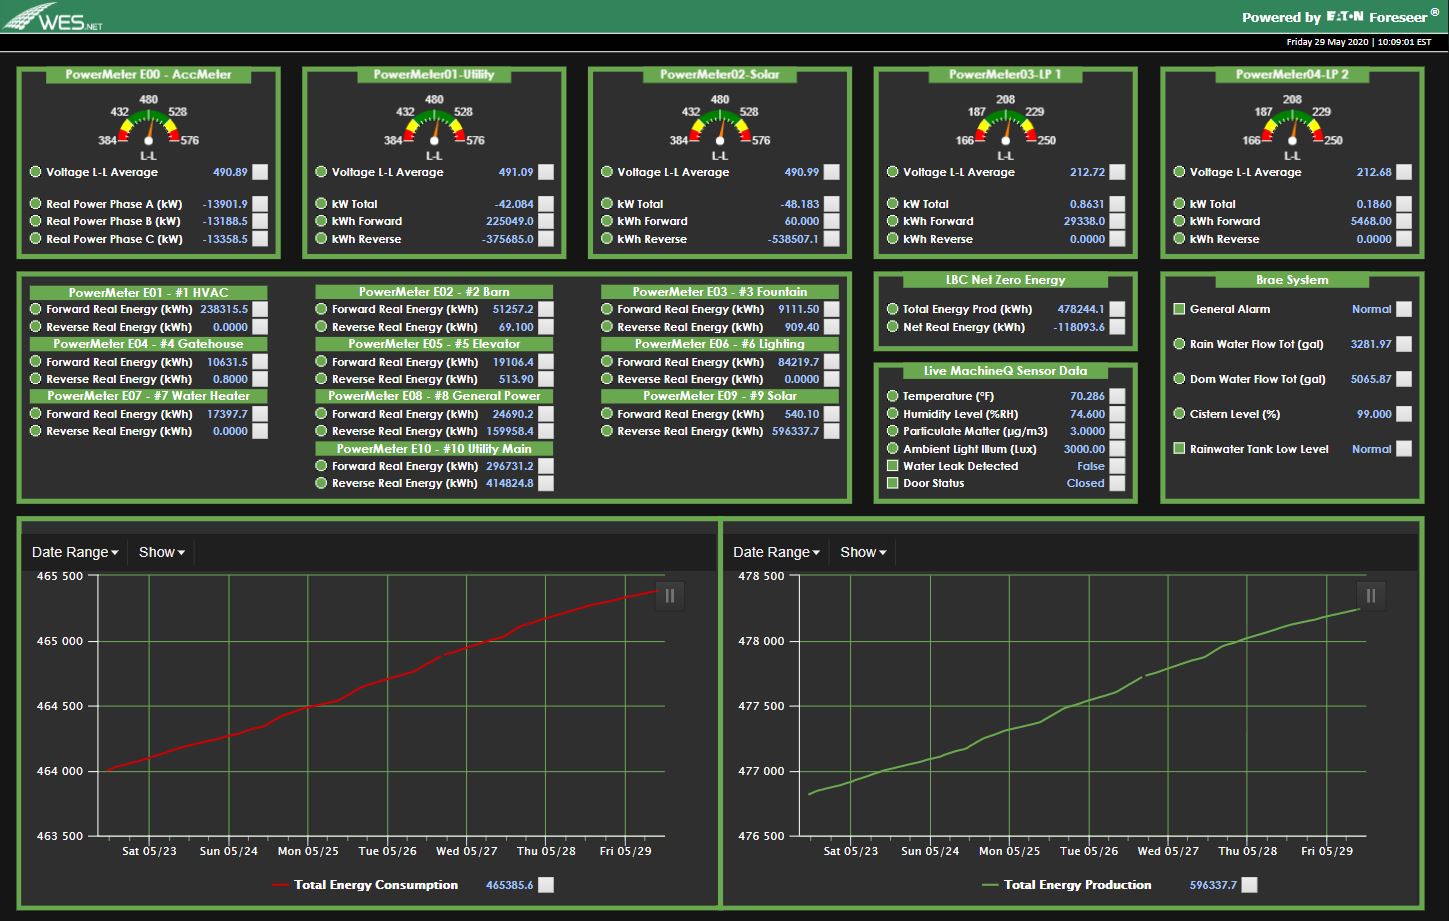
With the development and deployment of a customized Foreseer Monitoring System, WES provided key energy and environmental data through customized dashboards that graphically illustrate site energy usage, carbon offset, solar energy production, and water conservation to document one of the greenest buildings in the world.
WES Chief Technology Officer Mark Welsko expressed his excitement for working on this cutting-edge project.
“Working with MachineQ and the Parks Conservancy has been an honor and tremendous educational experience for our organization,” he said. “We are proud that our work has contributed to Frick Environmental Center’s Living Building and will be forever memorialized in a database that students and professionals can use for generations to come.”
When the Frick Environmental Center was looking to increase the engagement and impact of their work they believed that there was a need to illustrate the true value of their approach to saving energy and improving resiliency. The plan was to show a discreet, system by system picture of real time data in a granular dashboard and translate that data into meaningful information that visitors and the public could relate to.
WES assisted Frick in acheiving its Energy Management Goal of On-Site net zero energy strategies by 1) monitoring energy usage and 2) monitoring water usage and storage. Key points include real time production measurements from solar arrays, and real time water usage from the Barn, Fountain, Environmental Center.
Site personnel can utilize non-public dashboards for a more granular view of the detailed data. The monitoring system is connected to 5000 data points that are polled once a second from meters and end devices; processed measured and stored in the database at one minute resolution. Historic data is available for use in advanced analysis, modeling, and other energy awareness opportunities.


